Explainer · Revenue bridges
Price-Volume-Mix: why your revenue actually moved
By Jordan Supowit · ~7 min read
The board doesn’t need to know revenue grew. They need to know why.
Every finance team can produce the headline: revenue was up 6% versus last year. Almost none can answer the second question well: why.
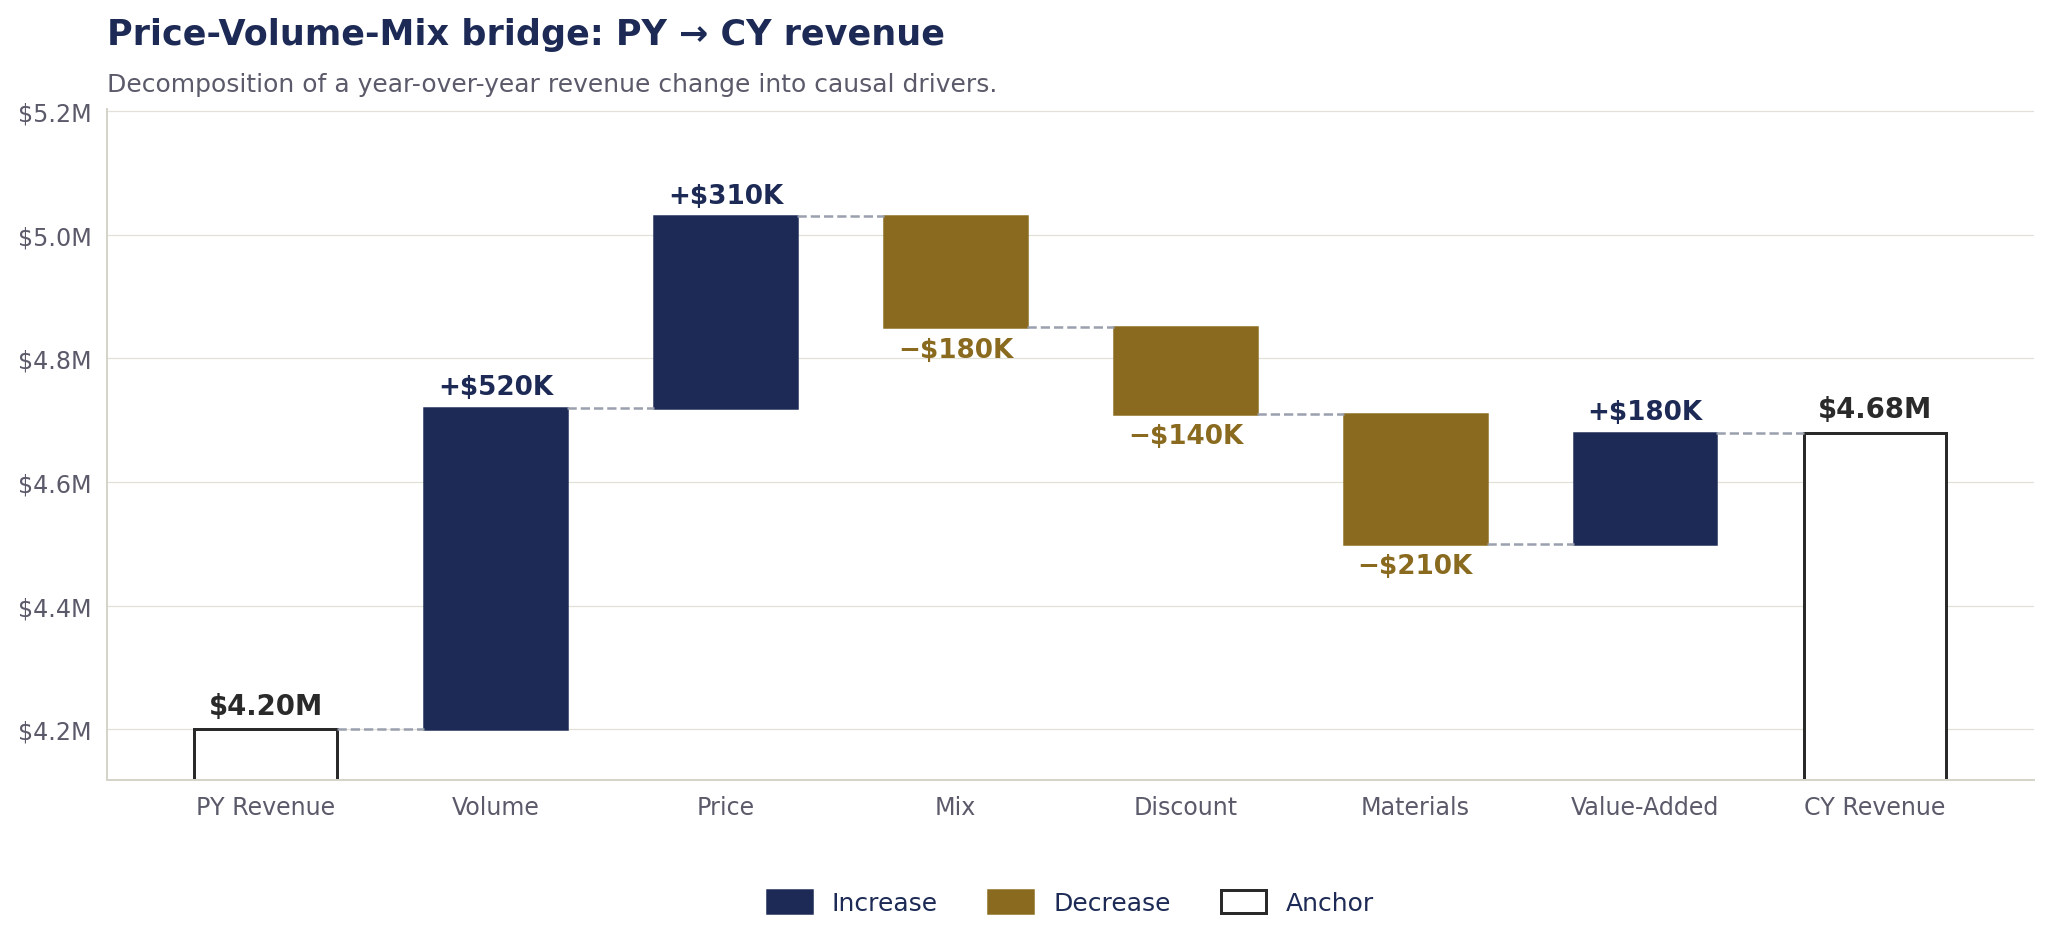
A Price-Volume-Mix (PVM) bridge is the answer. It decomposes a period-over-period change in revenue (or margin, or cost) into the causal drivers that produced it — so leadership can stop arguing about whether the number is good or bad and start arguing about what to do.
The five (or seven) drivers
For a revenue bridge, the canonical decomposition is:
- Volume — we sold more (or fewer) units.
- Price — our list prices moved.
- Mix — our sales shifted toward higher- or lower-priced SKUs, even if no individual price changed.
- Discount — we conceded more (or less) off list at the point of sale.
When you extend the bridge down to gross margin, two more drivers join:
- Materials — the cost of raw inputs moved (commodity swings, supplier renegotiation, freight).
- Value-Added — the cost we add at conversion moved (labor rates, overhead absorption, productivity).
And for multi-currency businesses, FX is a seventh driver bolted on the front, stripped out of every other line before the decomposition runs.
The math, briefly
For a single product comparing prior year (PY) to current year (CY), the textbook formulas are:
Volume effect  = (CY Vol  - PY Vol)  x PY Price
Price effect   = (CY Price - PY Price) x CY Vol
Discount       = (CY Disc  - PY Disc) x CY Vol      (negative of price)
Materials      = -(CY MatCost - PY MatCost) x CY Vol
Value-Added    = -(CY VACost  - PY VACost)  x CY Vol
Mix only shows up when you have a portfolio of products and compute weighted-average price across them:
Mix effect = sum over products of
             (CY Mix% - PY Mix%) x (PY Product Price - PY Portfolio ASP) x CY Total Vol
There’s no single “right” formula — what matters is that Volume + Price + Mix + Discount + Materials + VA reconciles to (CY revenue − PY revenue) without a plug. That reconciliation is the test of whether your bridge is honest. If you see a “Check” line that isn’t zero, the bridge is lying.
A note on the interaction term. Pure decomposition leaves a cross-term — the piece of the variance that requires both price andvolume to have moved. Different shops park it in different buckets (some allocate it to Volume, some to Price, some leave it as a labeled interaction line). Pick a convention, document it, and stop relitigating it every cycle.
The teaching model (Apples & Bananas)
The smaller of the two downloads — PVM-Cost-Mat-VA.xlsx — is a deliberately tiny model: two products, two periods, all formulas exposed. It walks PY revenue of 250 to CY revenue of 264.60 by computing each driver on its own line:
PY              250.00
Volume          +25.00
Mix             +7.50
List Price      -53.00
Discount        -15.50
Materials       +24.35     (margin bridge)
Value-Added     +26.25     (margin bridge)
CY              264.60
Check             0.00
It’s the model I’d hand to a new analyst on day one. Every cell is a visible formula; no macros, no hidden sheets, no goal-seeks. The point is to see the mechanics, not to admire the wrapper.
The applied case (Coffee Shop)
The larger download — Coffee-Shop-PVM.xlsx — takes the same method and runs it across a portfolio: 18 SKUs spanning six categories (Coffee Beans, Equipment, Services, Accessories, Merchandise, Decor, Seasonal). Same year-over-year comparison, but now with:
- A Raw tab with the source dataset, one row per product/year.
- A Transformed tab that calculates unit cost, gross revenue, gross discount, and the per-product PVM drivers.
- A category slicer and Top/Bottom rankings by Volume, Revenue, and Profit — so leadership can see which categories pulled the bridge which way.
This is what PVM looks like once it leaves the textbook: most of the work is in the data layer, not the math. The decomposition itself is twenty cells; the infrastructure that feeds it is the actual job.
When PVM earns its keep
Three places I reach for it on every engagement:
- Monthly variance reporting. Replace “revenue $X favorable” with a chart that names the drivers. Stops the same five executives from asking the same five clarifying questions on every call.
- Budget and forecast walks. When AOP shifts from version 1 to version 2, PVM tells finance whether the change came from rate (the assumption moved) or volume (the demand call moved). Different problems, different fixes.
- M&A integration tracking. Post-close, is the acquired entity hitting its number because the underlying business grew, or because we layered in price? PVM forces the answer out into the open.
What this isn’t
PVM is a decomposition, not a forecast. It tells you what happened, cleanly. It doesn’t tell you whether the price you took was the right one, whether the mix shift was deliberate, or whether the volume came from share or from the market. Those answers live in the commercial conversation that the bridge enables — not inside the bridge itself.
That’s the trade. PVM gives finance a clean structural answer to a structural question. The strategy work is what you do with it.
Download the files
Both files are fully synthetic — no client or employer data. Free to use, modify, and share. If you build on them, I’d love to see what you do with the method: jordan@supowit.com.